

Hi folks, today's article is all about speeding up a website. I will explore using Google PageSpeed Insights, a free website performance testing utility, to identify possible performance issues on my website and see if I can correct them in order to give my users the best and fastest browsing experience possible.
Introduction
All right, first things first. I'm going to be testing a fake version of my website, that looks and feels much like this one (at least at the time of this writing). My goal is to test the performance using PageSpeed Insights, and improve my overall score where a higher score indicates a more performant website. And full disclosure, I did purposefully use some not-so-best practices on my fake website, to hopefully give us a better example of what PageSpeed Insights can do for us.
I firmly believe in speed testing all of my public facing websites. How many times can you say you attempted to click on a website, it sat there, and it spins, spins, and spins for a few seconds. If you're like me, a lot of the time if I need information quickly and I know there's a lot of sites out there with information I need, I'm not going to wait more than several seconds to wait on a web page to load. If the site fails to load its content fairly quickly, it's on to the next. Testing our websites is crucial to preventing and/or addressing issues that might drive users away from our websites.
Now, without further ado, allow me to type my fake website into the tool...

Testing My Website's Speed
After giving PageSpeed Insights several seconds to do it's thing and fetch and measure speed as it relates to my website's content. Here's what I'm greeted with.
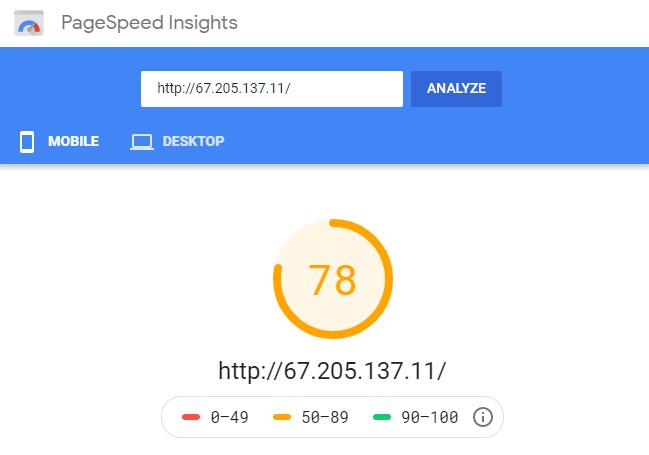
So for mobile, I received a score of 78 out of 100. That's passing right? Let's see what else the PageSpeed Insights report is telling us.
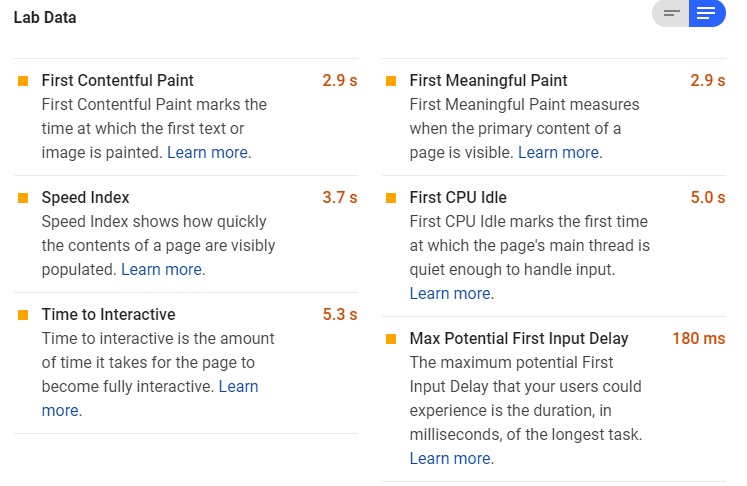
The data above shows us some timing metrics. I'm most interested in the First Meaningful Paint, the time it takes for our users to see the meat of our content, and Time to Interactive, the amount of time it takes before our users can do something (such as scroll, or clicking a call-to-action). These two metrics took 2.9 seconds and 5.3 seconds respectively.
Further below the fold on the PageSpeed Insights report are some suggestions of speed improvements.
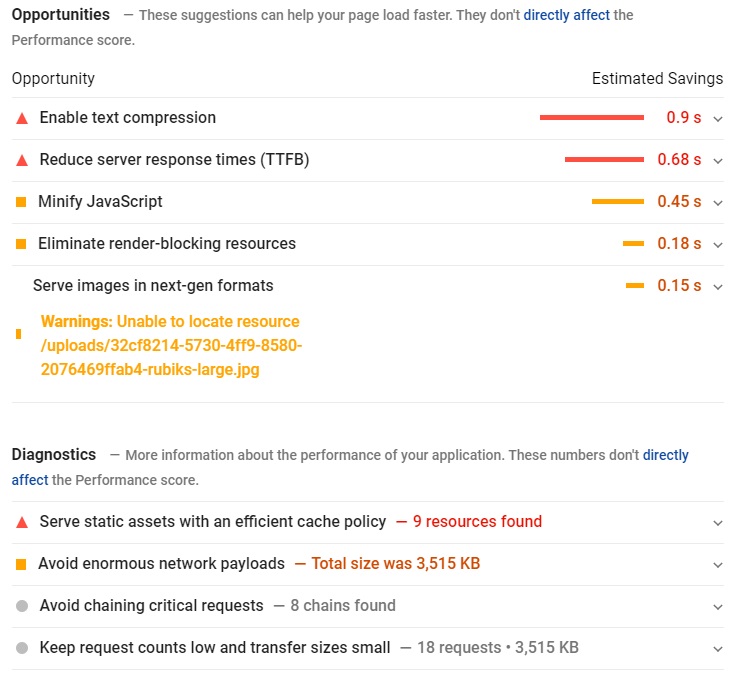
There's quite a bit going on here, but it looks like the most impactful suggestions are enabling text compression, reducing the server's reponse time (or time to first byte, TTFB), and minifying the page's JavaScript.
Enabling Text Compression
If we dig deeper, the report expands on Enable text compression. It states, "Text-based resources should be served with compression (gzip, deflate or brotli) to minimize total network bytes." What this means is my web server, which happens to be NGINX, is sending all of the files in website in their raw, uncompressed form. If we could enable compression, we may be able to reduce the overall size of these files, so we're not sending such large files across the Internet. It's not an unlikely scenario these days we're on our smart phones on a slow cellular connection where this would have the biggest slowdown.
For my fake website, I'm going to adjust my NGINX configuration on my hosted server to compress the output of my files before sending them across the Internet. I will be adding the following simple gzip configuration to my NGINX configuration to enable gzip, a widely adopted compression utility.
gzip on;
gzip_vary on;
gzip_min_length 1024;
gzip_proxied expired no-cache no-store private auth;
gzip_types text/plain text/css text/xml text/javascript application/x-javascript application/xml;
gzip_disable "MSIE [1-6]\.";
Reduce Server Response Times (TTFB)
A slow time to first byte, or TTFB, on a reasonably fast Internet connection usually indicates there's a problem with the server. There's a lot of reasons why a server could be slow. Perhaps the page has a database query that's slow to execute? Maybe there's a lot of concurrent traffic, and the server is reaching it's limit? It could be time to upgrade that hosting plan, or considering scaling the website up (or scaling out!). Nevertheless, in my fake website, I've artificially slowed web pages to take an extra second or two to simulate a slow database query. My fix for TTFB will be to remove this artificial slowdown.
Minify JavaScript
The tool is complaining that my JavaScript isn't minified. As PageSpeed Insights defines it, "Minification is the process of removing whitespace and any code that is not necessary to create a smaller but perfectly valid code file."
Here's what unminified JavaScript might look like.
function heresMyFunction(doSomething) {
  if (doSomething) {
    var isSpeedTested = false;
    console.log(isSpeedTested);
  }
}
And now, the above JavaScript, minified.
function heresMyFunction(n){if(n){console.log(!1)}}For my fake website (and real one for that matter!), I automate the task of minifying JavaScript and CSS files using Gulp. If you've never used Gulp to automate some common web development tasks such as minification, code linting, or refreshing your browser automatically when saving files, I highly recommend taking a look at Gulp.
My fix for minifying JavaScript (and CSS as well) will be to add steps in my Gulp configuation (in my case the gulpfile) that will output minified files for me. Luckily, I don't have to maintain a codebase of this!
Avoid Enourmous Network Payloads
PageSpeed Insights is telling me the page it tested worked out to be 3,515 KB. That's pretty darn large for a small handful of images and text. One of the downloaded images worked out to 2.6MB by itself. What I'll do with this particular image is ensure its saved as a JPEG, a highly compressible image format, and give it a reasonable level of compression to where I don't notice a huge loss in image quality, and make sure the image is a reasonable size.
There's several good online tools for this task. Photoshop has the capability to adjust the compression and size of images. Even using MS Paint, you can adjust the size and save the image as a JPEG.
In my case, I was able to resize and increase the compression of the image to get the file size down from 2.6MB to 163 KB. Yes, kilobytes! That's a massize savings in file size, and the image looks nearly identical despite the compression and smaller size.
The results
Ok, I've enabled text compression on my NGINX server, "fixed" the slowness on my server, minified a bunch of my static assets, and reduced the file size of a single particularly large image. Let's re-test with PageSpeed Insights, and see if our performance numbers improve.
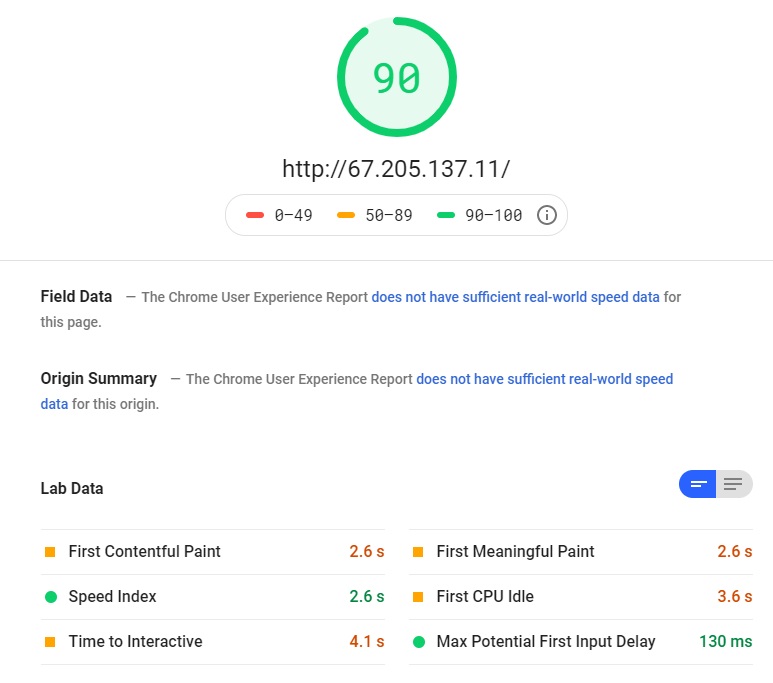 We're now in the green! Our paint time is now 2.6 seconds, down from 2.9 seconds, about a 10% improvement, in the test without the performance optimizations. Our Time to Interactive is now 4.1 seconds, down from 5.3 seconds, about a 22% improvement.
Conclusion
By using PageSpeed Insights, we were able to quickly pinpoint some glaring performance issues with the fake site. Using what we learned from the report, we were able to quickly address some of the top issues, and go from what's considered just "okay" performance to what's considered "good."
The improvements might not have been groundbreaking considering we're talking about a 0.3 second faster display time and a 1.2 second faster interaction time. But do consider, my website in its current state is not very large. If I had a lot more content to serve than just a handful of images and several paragraphs of text, I'd see an even larger improvement. Also consider that major some major retailers have gone so far as to correlate a 0.1 second slowdown to a 1% loss in sales. I was able to get a 0.3 second improvement by taking some low hanging fruit.
Having said all of this, I highly encourage testing your website using a speed checking tool such as Google PageSpeed Insights if you haven't already. There's many other similar tools out there, and I'd encourage you to research and try others as well.
Happy coding!